Top Risk Management Metrics Every Leader Must Track in 2026
Most risk decisions fail not from lack of effort but from lack of measurable clarity. Relying on gut feelings instead of data can misallocate resources, miss emerging threats, and erode executive confidence. U.S. leaders face growing regulatory scrutiny, frequent audits, and complex risks, making visibility essential.

Without meaningful risk management metrics, you cannot effectively prioritize what matters or clearly report to the board, leaving your strategy vulnerable to surprises and second-guessing. Today, 62% of organizations report critical risk events in the last three years, highlighting the stakes of inadequate risk measurement.
In this blog, we will walk you through what risk management metrics you should track, how to interpret them for smarter decisions, and how to operationalize these metrics across your teams.
Key Takeaways
- Risk management metrics help leaders make informed, defensible decisions by improving visibility and prioritization.
- Effective metrics measure exposure, control performance, outcomes, and response speed to support exam readiness.
- Metrics should align with business decisions, risk appetite, and measurable business impact.
- Consistency in definitions, ownership, and review cadence is critical for reliable, auditable reporting.
- Centralized and scalable execution enables sustained oversight and executive confidence.
Did you know? A detailed 2025 enterprise risk oversight report found that 61% of executives say risk complexity is rising, yet only 32% rate their risk oversight as mature or strong. This highlights a persistent gap between risk challenges and organizational readiness.
What Risk Management Metrics Measure
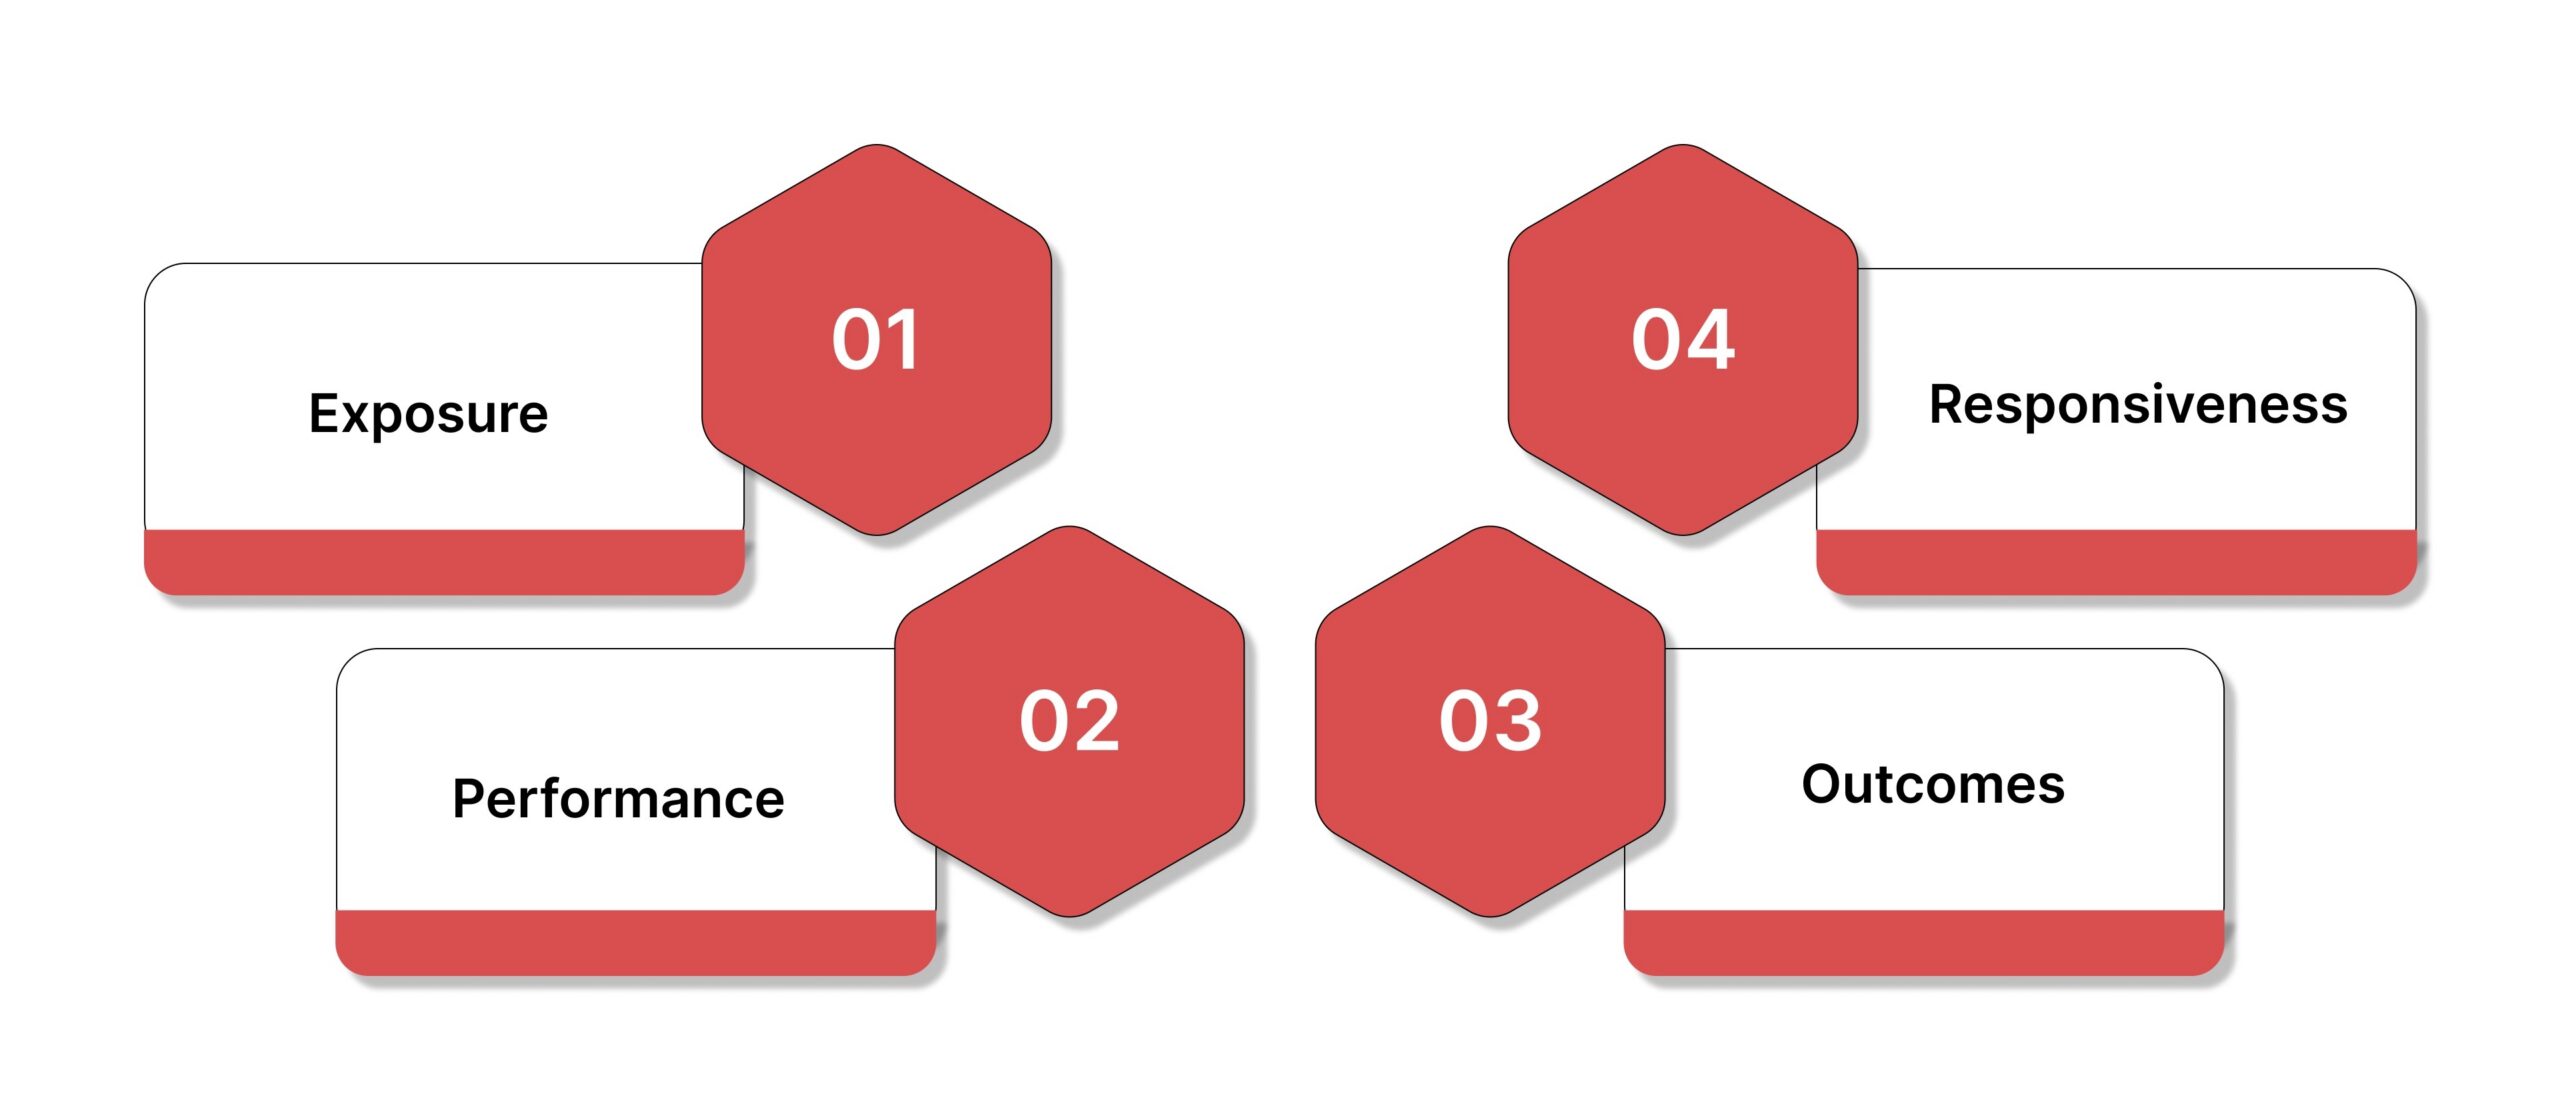
For compliance leaders, risk management metrics translate complex exposures into clear signals you can act on with confidence. They help you evaluate whether your controls work, whether risks stay within appetite, and whether your program stands up during regulatory exams.
Below are the core dimensions that effective risk management metrics must measure:
- Exposure: Measures the level of risk your organization currently faces across underwriting, claims, third-party, and operational activities. Clear exposure metrics help you prioritize remediation before risks escalate into regulatory findings or financial losses.
- Performance: Evaluates how well your controls, policies, and risk processes operate in practice. These metrics reveal whether assigned controls actually reduce risk or merely exist on paper during state examinations.
- Outcomes: Tracks realized incidents, losses, and control failures over time. Outcome metrics provide evidence of program effectiveness and support trend analysis during audits, exams, and executive reviews.
- Responsiveness: Measures how quickly you identify, assess, and address risks or control gaps. Strong responsiveness metrics demonstrate operational maturity and improve examiner confidence in your risk oversight approach.
To understand how risk management metrics work in practice, it’s important to distinguish between the different types of indicators used to measure performance, exposure, and control effectiveness.

KPIs Vs KRIs Vs KCIs
Compliance teams often track risk data without clearly separating performance, early warning signals, and control health. This creates confusion during state examinations, executive reporting, and internal reviews.
Below is a clear, operational comparison of KPIs, KRIs, and KCIs:
| KPI | KRI | KCI |
| Measures risk program performance | Signals rising risk levels | Measures control operating health |
| Lagging or outcome-focused | Leading and predictive | Preventive and control-focused |
| Evaluates process efficiency | Identifies emerging exposure | Confirms control effectiveness |
| Supports management accountability | Triggers escalation and action | Supports exam and audit evidence |
When You Use KPIs
- During monthly operational reviews to assess the risk process efficiency
- In management, reporting to evaluate progress against risk objectives
When You Use KRIs
- In ongoing monitoring to detect early signs of heightened exposure
- During executive or board reporting to support forward-looking decisions
When You Use KCIs
- Before and during regulatory examinations to validate control operations
- In audit preparation to demonstrate consistent, repeatable risk controls
Also Read: End-to-End Supply Chain Risk Management: Best Practices & Solutions
Once you understand the role of KPIs, KRIs, and KCIs, the next step is selecting the right mix of metrics that actually support informed, defensible decision-making.
How To Choose Risk Management Metrics That Drive Decisions
Selecting the right risk management metrics is not about volume. It is about enabling defensible decisions under regulatory pressure. Below is a decision-first framework to help you choose metrics that actually drive action:
- Start With Decisions: Identify the exact decisions you need to make, such as approving remediation budgets, reallocating compliance staff, prioritizing corrective actions, or addressing vendor risk exposure. Metrics should exist only to inform these decisions, not to populate dashboards.
- Align To Risk Appetite: Define clear thresholds that reflect leadership-approved tolerance levels. When a metric crosses a threshold, it should automatically signal investigation, escalation, or corrective action, removing subjectivity from risk response.
- Tie To Business Impact: Connect each metric to tangible outcomes, such as financial loss, operational disruption, regulatory scrutiny, or reputational harm. This alignment strengthens executive understanding and supports exam discussions with a clear rationale.
- Use Leading and Lagging Metrics Together: Combine early indicators with outcome-based measures to avoid reactive risk management. This approach helps you detect rising exposure while validating whether prior decisions produced meaningful results.
- Make Metrics Auditable: Ensure consistent data sources, defined ownership, and documented methodologies. Auditable metrics improve exam readiness and provide defensible evidence during regulatory inquiries and internal audits.
With a clear framework for selecting meaningful metrics, the focus now shifts to the specific risk management metrics that deliver the most value for oversight, prioritization, and exam readiness.
The Most Important Risk Management Metrics To Track
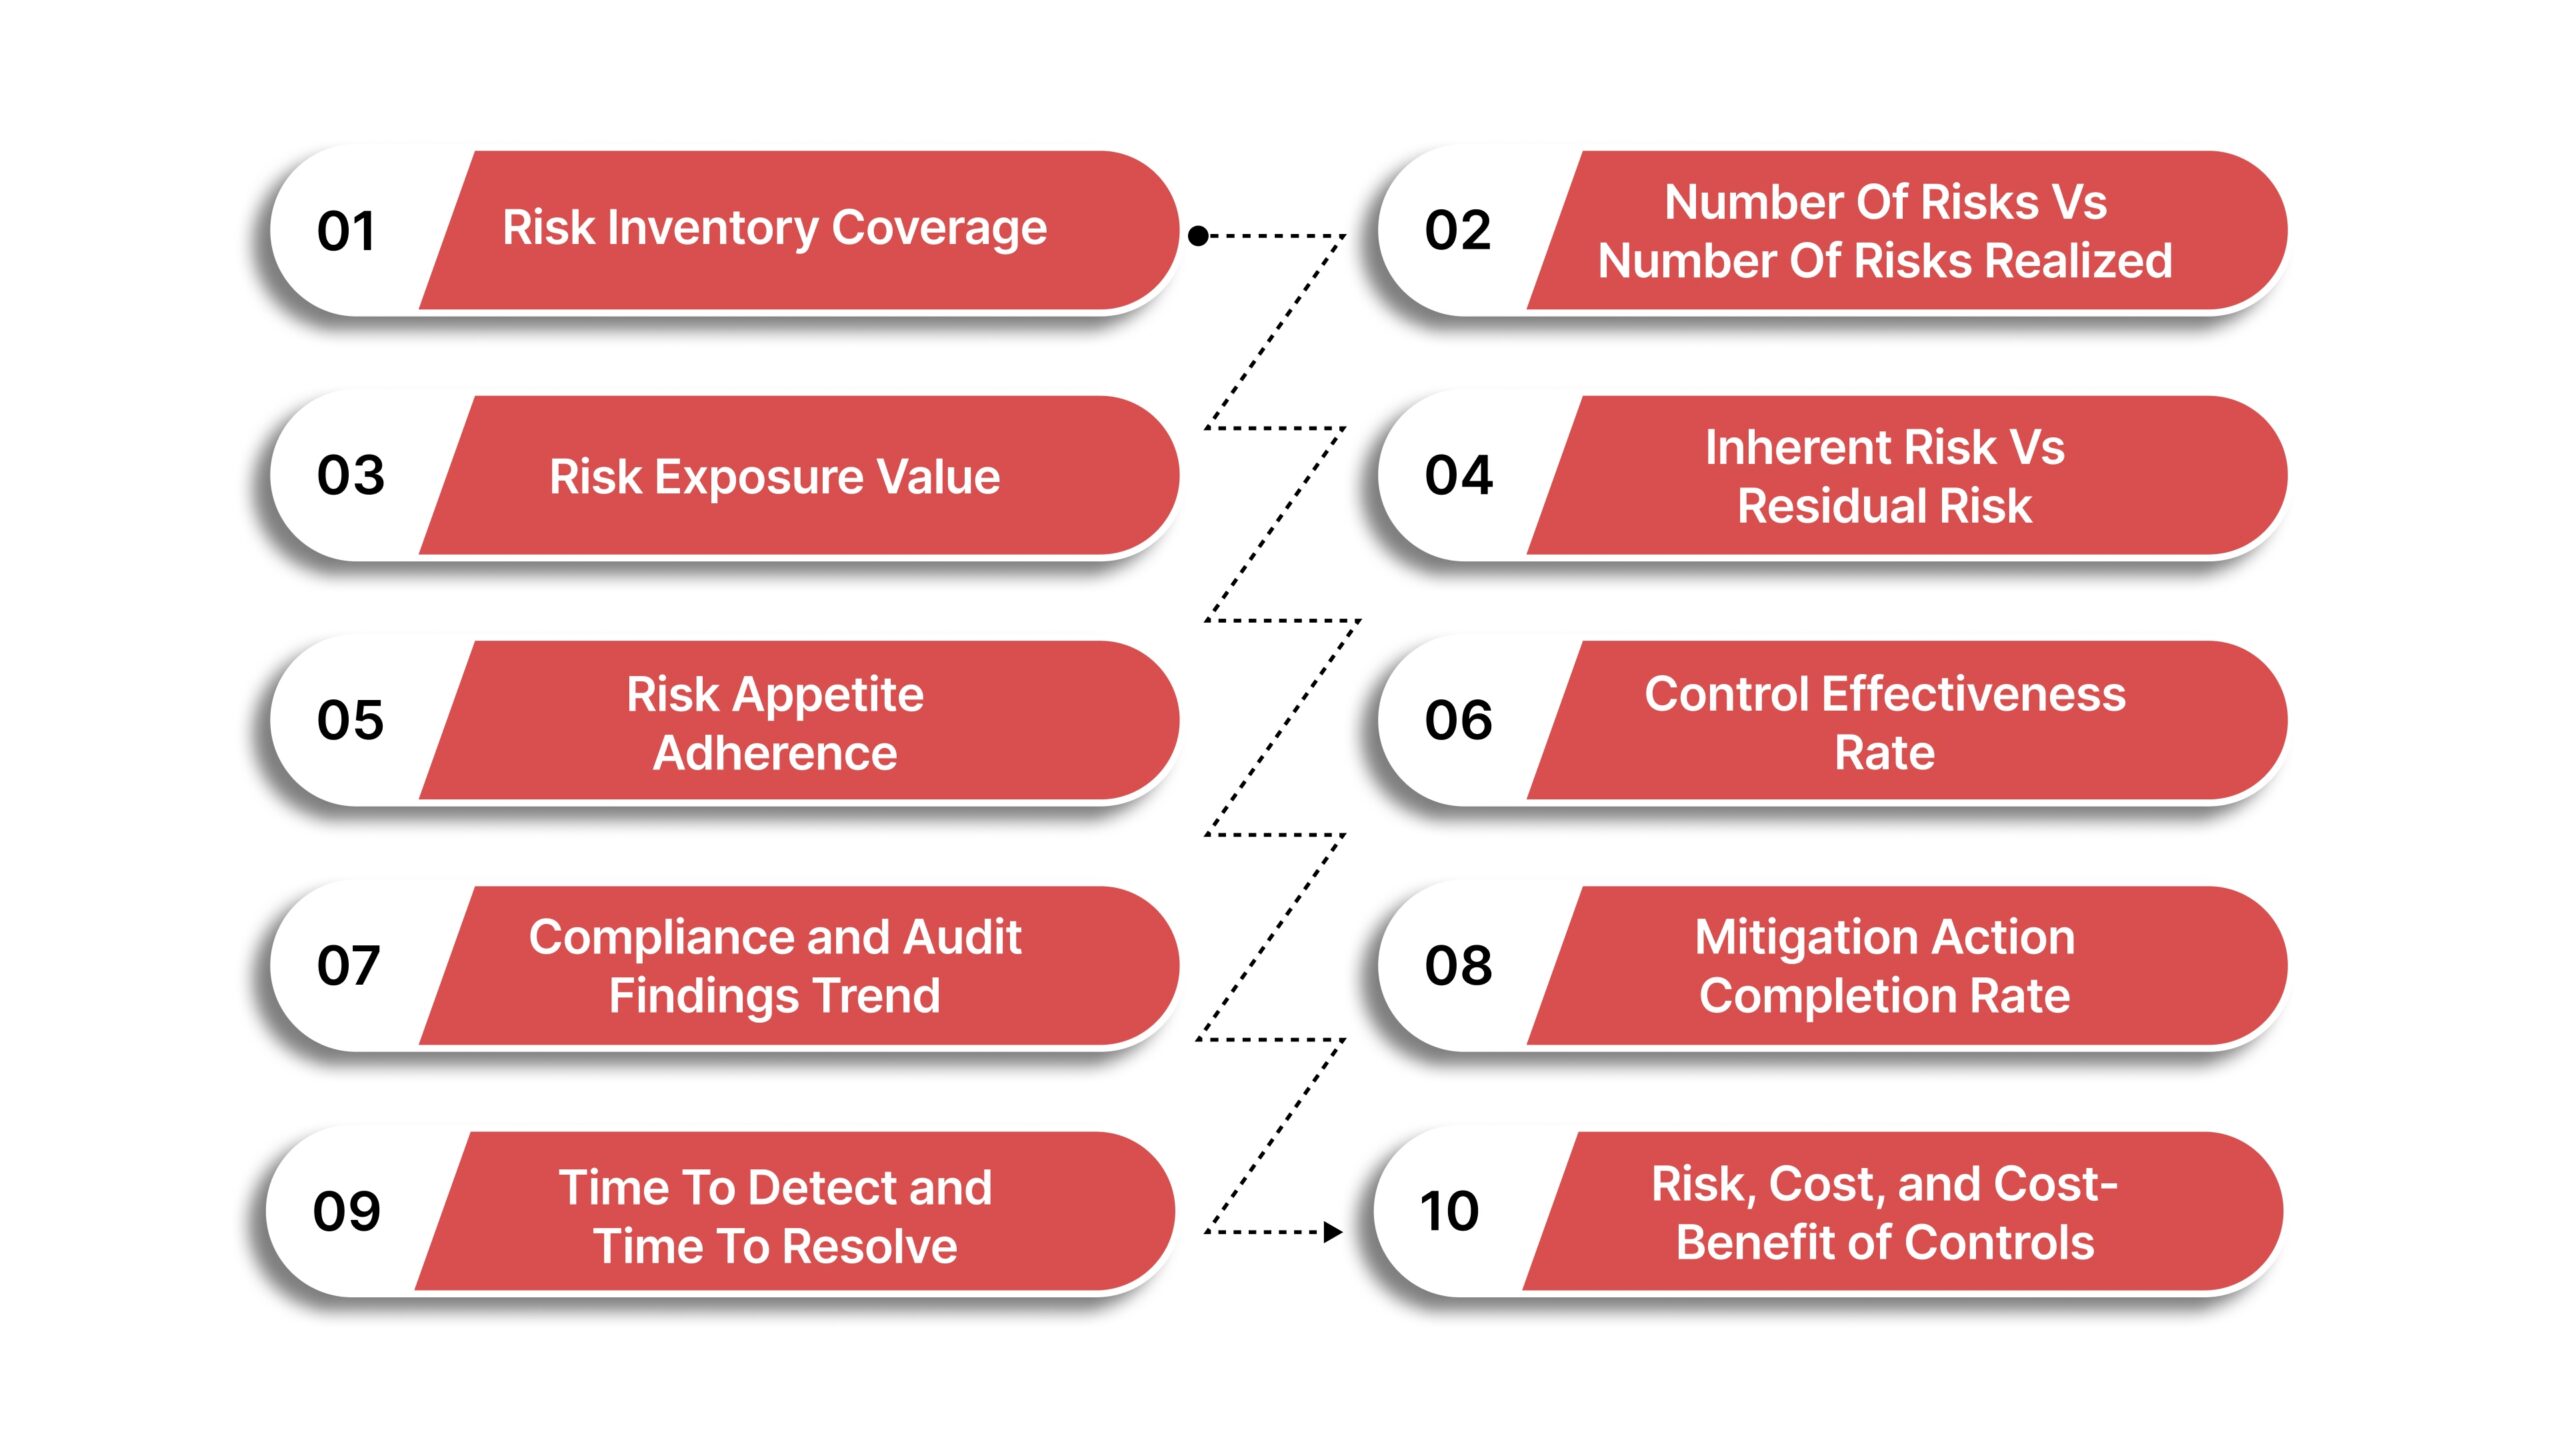
Not all risk management metrics deliver the same decision value. Compliance leaders must focus on metrics that directly support prioritization, oversight, and exam readiness, rather than generic risk counts.
Below are the key risk management metrics you should track to drive informed, defensible decisions:
Risk Inventory Coverage
Risk inventory coverage shows whether your risk program actually reflects how your business operates. Without full coverage, compliance teams often discover gaps during state examinations, when undocumented risks surface unexpectedly. This metric helps you confirm that critical activities, systems, and relationships are consistently assessed and owned.
Below are the key components of an effective Risk Inventory Coverage metric:
- What It Measures: The percentage of critical business processes, systems, and assets that have formally documented and reviewed risks. This includes underwriting workflows, claims operations, data systems, and third-party service providers.
- Why It Matters: Risks that are not identified cannot be evaluated, monitored, or mitigated. Incomplete coverage weakens prioritization and reduces confidence during regulatory reviews and internal governance discussions.
- What To Include In The Definition: Clearly define scope boundaries, including applicable business units, regulated entities, core systems, and vendor categories. Consistent scope rules ensure accurate comparisons and reliable reporting across reporting periods.
Number Of Risks Identified Vs Number Of Risks Realized
This metric compares the risks you anticipated with the events that actually occurred across your operations. It helps you assess whether your risk identification and monitoring processes surface issues early enough to prevent regulatory findings, operational disruption, or financial loss.
Below is how to apply this metric for meaningful insight:
- What The Comparison Reveals: Evaluating identified risks against realized events highlights gaps in detection. When incidents occur without prior identification, it signals blind spots in risk assessments or incomplete coverage of business activities.
- How To Interpret Rising Realized Risk: An increase in realized risks may indicate declining control effectiveness, outdated risk assessments, or insufficient monitoring cadence. It can also suggest changes in operational complexity or external conditions that require reassessment.
- How To Use It Operationally: Track this metric by risk category and business unit to support root cause analysis. Use findings to refine risk identification methods, strengthen monitoring controls, and improve exam readiness through documented corrective actions.
Risk Exposure Value
Risk exposure value allows you to compare unlike risks using a single, defensible measure. For compliance leaders, this metric supports prioritization decisions by translating abstract risk statements into quantifiable exposure that leadership can understand, challenge, and approve during governance reviews and examinations.
Below is how to define and apply Risk Exposure Value effectively:
- Expected Loss Calculation: Calculate exposure using a consistent likelihood-by-impact model. This approach enables you to compare regulatory, operational, and third-party risks on a common scale, supporting objective prioritization across business units.
- Defining Impact Meaningfully: Impact should reflect consequences relevant to operations, including system downtime, regulatory fines, claims processing delays, revenue loss, and erosion of policyholder trust. Select impact factors that align with your organizational risk appetite.
- Using Exposure For Decision Support: Rank risks by exposure value to guide remediation sequencing, funding allocation, and escalation decisions. Document assumptions and scoring criteria to strengthen audit trails and examiner confidence in your risk methodology.
VComply Risk Ops centralizes your risk inventory, assigns clear ownership, and tracks mitigation actions with consistent scoring. This ensures you measure exposure accurately, monitor control effectiveness, and respond quickly to emerging risks, providing executives with defensible, data-backed insights.
Inherent Risk Vs Residual Risk
Understanding the difference between inherent and residual risk is critical for demonstrating control effectiveness during regulatory examinations. This comparison shows whether your controls meaningfully reduce exposure or simply exist in documentation.
Below is a clear comparison to guide consistent application across your risk program:
| Inherent Risk | Residual Risk |
| Risk level before any controls are applied | Risk level after controls are implemented |
| Reflects raw exposure from operations | Reflects remaining exposure after mitigation |
| Assessed during initial risk identification | Assessed after control testing and review |
| Indicates potential severity | Indicates control effectiveness |
| Used to set mitigation priorities | Used to validate risk acceptance or escalation |
Instruction for Consistency: Define your scoring scale once, such as a standardized 1–5 model for likelihood and impact. Apply this scale uniformly across business units, systems, and risk categories to ensure comparability, auditability, and defensible exam outcomes.
Risk Appetite Adherence
Risk appetite adherence shows whether your organization operates within boundaries approved by leadership. This metric bridges daily risk activity and board oversight, helping demonstrate disciplined governance.
Below is how to define and use Risk Appetite Adherence effectively:
- What The Metric Measures: Tracks how frequently current risk exposure remains within leadership-approved thresholds across key risk categories. This includes operational, regulatory, technology, and third-party risks that materially affect operations.
- Why It Matters For Governance: Consistent adherence signals that risk-taking aligns with strategic intent. Frequent breaches indicate gaps in controls, monitoring, or escalation processes that require management attention before regulatory scrutiny intensifies.
- Board-Facing Value: Provides clear, defensible insight into whether the organization is operating within agreed limits. This transparency strengthens board confidence and supports informed discussions during governance reviews and examination preparation.
Control Effectiveness Rate
Control effectiveness rate shows whether your controls actually reduce risk, not just exist in documentation. This metric provides defensible evidence during audits and state examinations. It helps you demonstrate that controls operate consistently, adapt to change, and support reliable risk reduction over time.
Below is how to define and apply the Control Effectiveness Rate with confidence:
- What The Metric Measures: Evaluates whether controls perform as intended based on audit findings, control testing results, and observed failure rates. This measurement reflects actual operating performance rather than design assumptions.
- Why Control Drift Matters: Controls can weaken over time due to process changes, system updates, or staff turnover. Without regular measurement, control drift goes unnoticed until an audit or examination exposes gaps.
- How To Use The Results: Track effectiveness trends by control owner and risk category. Use declining performance as a trigger for remediation, retraining, or redesign to maintain exam readiness and operational resilience.
Compliance and Audit Findings Trend
Compliance and audit findings trends reveal whether your risk and control environment is improving or deteriorating over time. This metric supports exam readiness by demonstrating how effectively issues are identified, addressed, and prevented from recurring across regulated entities and operations.
Below is how to structure and interpret this metric effectively:
- Tracking By Severity: Classify findings based on impact and regulatory significance. Severity trends help you prioritize remediation efforts and allocate resources to issues that pose the greatest compliance and operational risk.
- Monitoring Recurrence: Repeated findings often indicate structural weaknesses in processes or controls. Treat recurrence as a signal to reassess root causes rather than addressing symptoms through isolated corrective actions.
- Measuring Closure Time: Track how long it takes to resolve findings from identification to verification. Extended closure times can raise concerns during examinations and may reflect ownership gaps or insufficient remediation planning.
With VComply Compliance Ops, your organization can automate tracking of audit findings, monitor recurring issues, and measure closure times effectively. This ensures consistent oversight, strengthens exam readiness, and gives compliance officers the tools to manage regulatory obligations with confidence.
Mitigation Action Completion Rate
Mitigation action completion rate shows whether risk responses move from approval to execution. This metric provides visibility into accountability and follow-through, which regulators often scrutinize during examinations.
Below is how to define and interpret Mitigation Action Completion Rate effectively:
- On-Time Completion Percentage: Measures the percentage of mitigation tasks completed by their assigned due dates. Consistent on-time completion reflects strong ownership, realistic planning, and disciplined execution across teams.
- Overdue Aging Buckets: Segment overdue actions by time frames, such as 30, 60, and 90 days past due. Aging analysis highlights escalation needs and supports targeted management intervention before examination findings arise.
- Quality of Risk Reduction: Completion alone does not equal success. When exposure levels remain unchanged after actions close, it indicates ineffective mitigation design or insufficient control implementation requiring reassessment.
Also Read: Top NAVEX Alternative for Risk Management in 2026
Time To Detect and Time To Resolve
Time to detect and time to resolve reveal how quickly your organization recognizes and addresses risk events. Regulators often view delayed detection or prolonged resolution as indicators of weak oversight and governance maturity.
Below is how to define and apply these metrics consistently:
- Time To Detect: Measures the duration between risk occurrence and identification. Shorter detection times indicate effective monitoring mechanisms and timely escalation across operational and compliance functions.
- Time To Resolve: Measures how long it takes to remediate a risk after identification. Faster resolution reflects clear ownership, efficient workflows, and adequate resourcing for corrective actions.
- Standardized Start and Stop Points: Define precise timestamps for when detection begins and resolution ends. Consistent definitions prevent reporting discrepancies and support reliable analysis during audits and examinations.
Risk, Cost, and Cost-Benefit of Controls
Risk cost metrics translate risk management from a compliance obligation into a financial discussion. This metric supports budget justification and executive alignment by showing whether investments in controls reduce losses and regulatory exposure.
Below is how to define and apply this metric with financial clarity:
- Tracking Risk Program Spend: Measure total costs associated with risk management activities, including control implementation, testing, remediation, and ongoing monitoring. Consistent tracking enables meaningful comparisons over time and across business units.
- Estimating Avoided Loss: Compare program costs against reduced incident severity, fewer regulatory findings, and minimized operational disruption. This comparison helps quantify the tangible value of effective controls.
- Costoff Controls Vs Cost of Failure: Present results using a CFO-friendly lens that contrasts prevention costs with potential financial, regulatory, and reputational losses. This perspective strengthens executive decision-making and reinforces the business case for sustained investment.
VComply’s GRCOps Suite unifies RiskOps, ComplianceOps, PolicyOps, and CaseOps into a single, integrated platform. By connecting data, ownership, and workflows across all GRC functions, it enables consistent reporting, audit-ready metrics, and end-to-end operational visibility, reducing silos and strengthening governance.
Now, the final step is presenting those metrics in a way that executives can quickly interpret, act on, and use to guide strategic decisions. Let’s have a look.
Reporting That Executives Will Actually Use
Executive reporting fails when it presents data without decision context. Leaders need clarity, not volume. Effective risk reporting translates metrics into focused insights that support accountability, funding decisions, and regulatory oversight.
Below is how to structure risk reporting that drives executive action:
- Highlight Risk Movement Since Last Review: Show how top risks have changed in exposure, trend, or priority since the previous reporting period. This comparison helps leadership focus on what requires attention now.
- Surface Residual Risks Outside Appetite: Clearly identify risks that exceed approved thresholds. Present these risks with supporting data to enable informed acceptance, mitigation, or escalation decisions.
- Call Out Overdue Mitigations With Business Impact: Link delayed actions to potential regulatory, operational, or financial consequences. This connection reinforces urgency and accountability.
- CEO and Board View: Focus on overall exposure, adherence to risk appetite, directional trends, and material risks that affect strategy and reputation.
- CTO View: Emphasize technology and cyber risk indicators, detection speed, resolution timelines, and emerging threats tied to systems and data.
- Compliance Leadership View: Prioritize audit findings trends, control testing outcomes, and remediation status to support exam readiness and internal assurance.
Also Read: Operational Risk Management Examples and Strategies
Even the best-designed reports can fall short if common mistakes undermine their effectiveness, making it essential to understand what causes risk metrics to lose value in practice.
Common Mistakes That Make Risk Metrics Useless
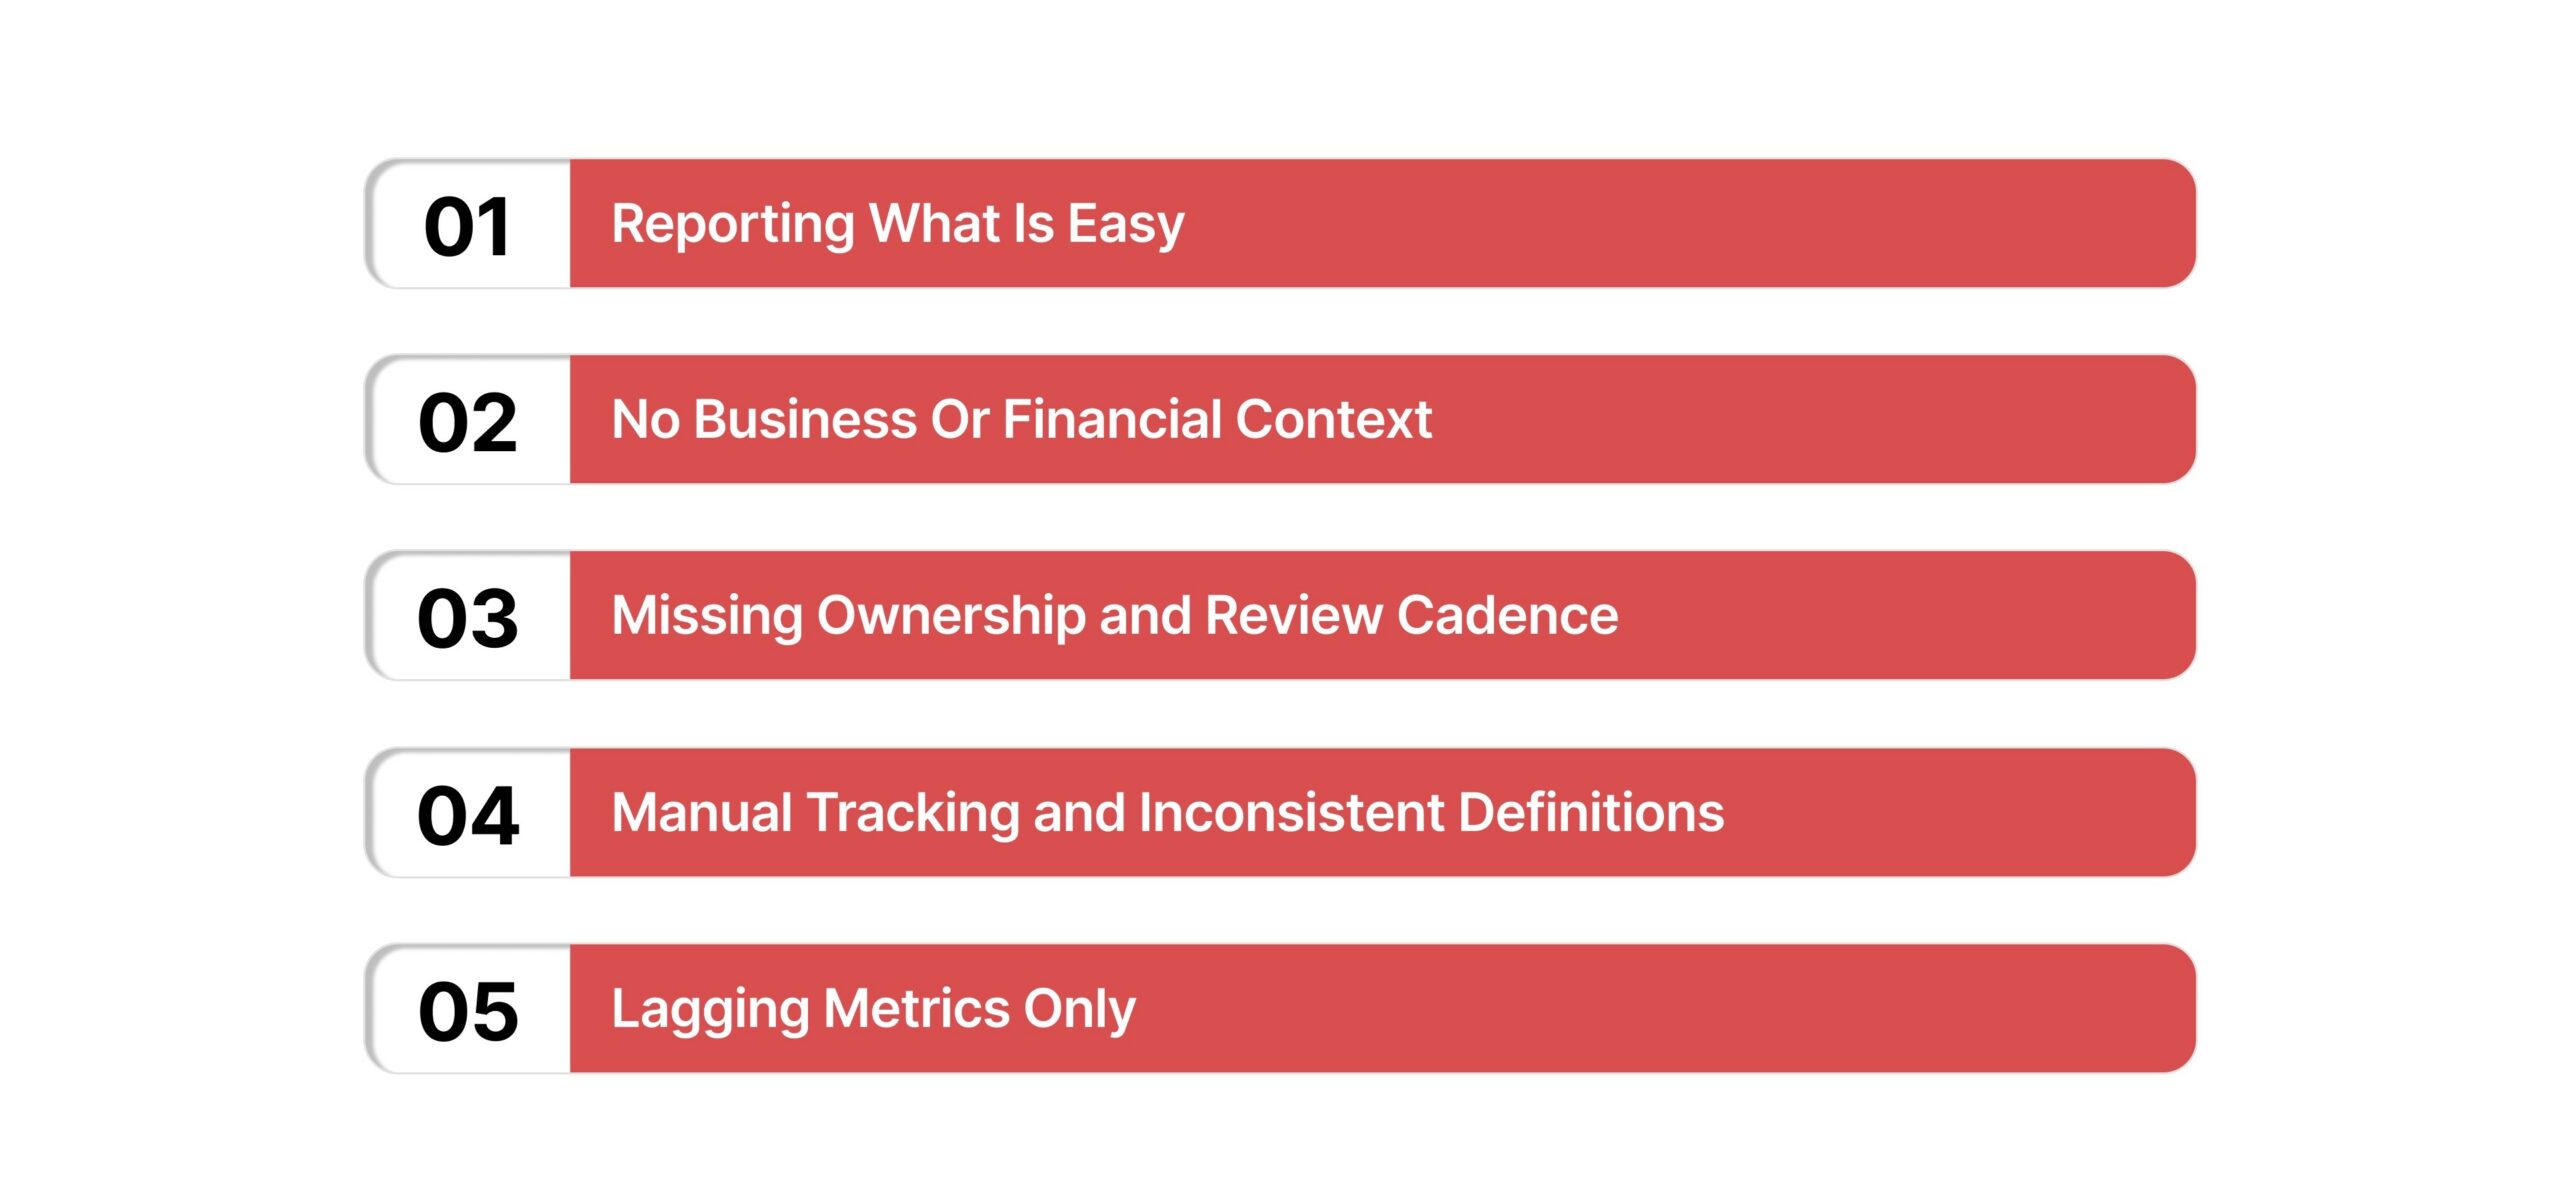
Even well-designed risk metrics fail when execution breaks down. These failures surface during examinations, executive reviews, or unexpected incidents.
Below are the most common mistakes that undermine risk management metrics:
- Reporting What Is Easy: Metrics chosen for convenience rarely influence decisions. When reporting focuses on available data instead of decision-critical insights, leadership lacks clarity on where action is required.
- No Business Or Financial Context: Metrics that lack operational or financial impact fail to resonate with executives. Without context, risks appear abstract and do not drive prioritization or funding decisions.
- Missing Ownership and Review Cadence: Metrics without clear owners or review schedules quickly lose relevance. Over time, stale data erodes confidence and weakens governance discipline.
- Manual Tracking and Inconsistent Definitions: Spreadsheet-based reporting introduces errors and inconsistent interpretations. Without a single source of truth, metrics cannot withstand audit or examination scrutiny.
- Lagging Metrics Only: Metrics that reflect outcomes alone provide insight after damage occurs. Without forward-looking indicators, organizations remain reactive rather than prepared.
After identifying the pitfalls that weaken risk metrics, the next step is enabling scale and consistency through a platform designed to operationalize risk management metrics across the organization.

How VComply RiskOps Helps You Run Risk Management Metrics At Scale
Managing risk management metrics at scale requires more than collecting data. You need structure, consistency, and evidence that withstands executive scrutiny and regulatory examinations. VComply RiskOps serves as the execution layer that connects metrics to ownership, action, and defensible outcomes across operations.
Below is how VComply enables scalable, decision-ready risk management metrics:
- Centralized Risk Register With Consistent Scoring: VComply RiskOps maintains a single, centralized risk register with standardized scoring models across business units. This consistency supports reliable exposure measurement, inherent versus residual risk analysis, and comparable reporting for leadership and examiners.
- Clear Ownership, Workflow, and Mitigation Tracking: RiskOps assigns accountable owners to each risk and mitigation action, supported by structured workflows and deadlines. This directly strengthens metrics such as mitigation action completion rate, time to resolve, and control effectiveness by ensuring follow-through and traceability.
- Dashboardforor Exposure, Trends, and Appetite Adherence: Real-time dashboards surface risk exposure values, trend movements, and appetite breaches in one view. These dashboards help leaders quickly identify emerging concerns, overdue actions, and risks operating outside approved thresholds.
- Audit-Ready Reporting and Cross-Ops Alignment: VComply unifies ComplianceOps, RiskOps, PolicyOps, and CaseOps, and the broader GRCOps framework. This alignment ensures risk metrics connect to compliance requirements, policy controls, incident handling, and audit evidence, delivering leadership visibility and examination-ready reporting without manual reconciliation.
Also Read: Enterprise Risk Management Fundamentals Overview
Book a demo with VComply and see how scalable processes and real-time visibility drive smarter risk management decisions.
Final Thoughts
Risk management metrics give you a defensible way to move from reactive compliance to proactive decision-making. When you track the right metrics, you gain clarity on where exposure is increasing, which controls actually work, and how risk aligns with business priorities. Strong risk management metrics help leaders make timely, confident decisions under regulatory and operational pressure.
VComply enables you to operationalize risk management metrics across your organization with consistency and scale. Through its integrated RiskOps, ComplianceOps, PolicyOps, and CaseOps capabilities, VComply connects risk data to ownership, workflows, and audit-ready reporting, helping you maintain visibility, accountability, and exam readiness at all times.
Start your 21-day free trial to see how VComply helps you turn risk management metrics into smarter, actionable decisions.
FAQs
Risk management metrics should be reviewed based on their purpose and impact. Operational metrics often require weekly or biweekly review, management-level metrics are typically reviewed monthly, and board-facing metrics are best reviewed quarterly to support oversight and strategic decisions.
Approval responsibility usually sits with senior leadership, a risk committee, or executive management. Their role is to ensure metrics align with business objectives, risk appetite, and governance expectations, and that reported data supports informed decision-making and accountability.
Yes, risk management metrics can vary based on state-specific regulatory requirements, business models, and operational exposure. Organizations operating across multiple states often adjust metrics to reflect jurisdictional risk while maintaining a standardized measurement framework.
Risk management metrics provide documented evidence of consistent risk identification, monitoring, and remediation. During examinations, regulators rely on these metrics to assess governance maturity, control effectiveness, and whether issues are identified and addressed in a timely manner.
Enterprise risk metrics focus on organization-wide exposure and strategic risks, while operational risk metrics measure risks within specific processes or functions. Both are necessary to provide leadership with a complete view of risk across strategy and day-to-day operations.